Energy-efficient design in buildings is helping reduce the carbon footprint of our communities and manage future energy costs in North America. A key element in achieving energy efficiency is to measure and verify energy savings and emissions reductions, ensuring that low energy buildings continue to perform: enter RDH.
In 2013 RDH was retained to undertake a two-part study focused on the measurement and verification of energy savings in a sample of residential, community, commercial and mixed-use buildings, all of which were designed as high-performance developments and constructed within the last ten years.
This four-part blog series shares lessons learned and key findings from our work. In Part 1, we explored the measured performance of a handful of recent high-performance buildings. In Part 2, we dig deeper into how performance can vary from the intended design or energy model. And Parts 3, and 4 will discuss how building designers, owners, and managers can ensure their buildings perform at their best.
In Part 1 of this blog series, we discussed energy modelling for new buildings and the importance of verifying energy consumption once a building is completed and in use. In Part 2, we went on to highlight the importance of model calibration and comparison, noting that often, modelled and verified savings can differ. This leads us to the third installment and a discussion of why actual energy savings may be different from those modelled, and what building designers, owners, and managers can do to ensure they are meeting their energy goals.
Why are predicted energy savings and verified energy savings different?
Building Enclosure
There are a variety of reasons why the energy savings of a building are different—whether better or worse—than modelled. Among them is the building enclosure’s performance, and how well its details were reflected in the energy models.
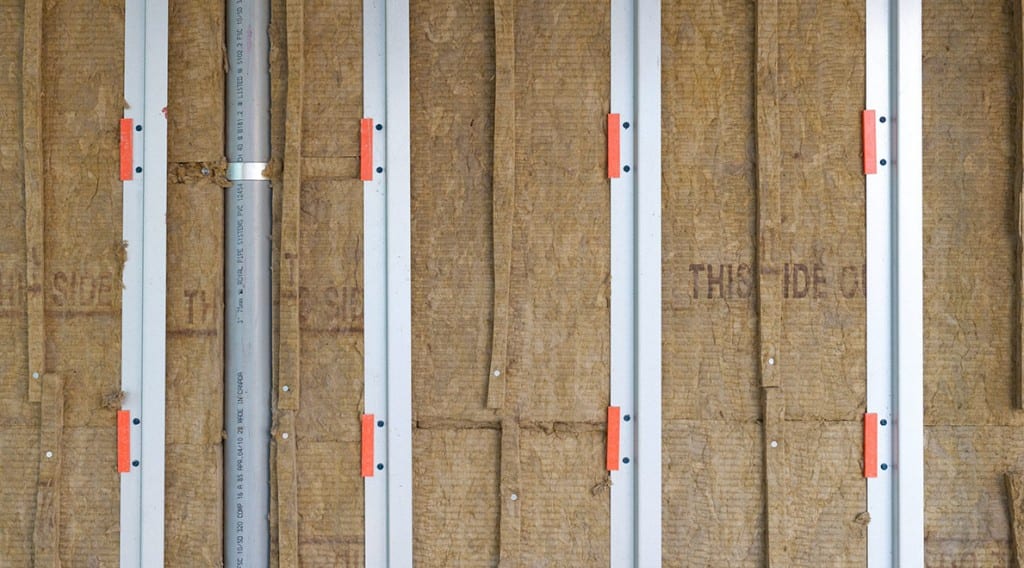
In the case of the RDH study, all models used nominal or insulation-only R-values. R-values, a measurement of how well insulated a wall is, can be presented as a nominal value, taking into account the insulation alone, or as an effective value, which factors in the wall assembly being used and its impact on the efficacy of the insulation. At the time these buildings were modelled, there was less awareness of thermal bridging and it’s significant reduction on enclosure performance.
There is, however, a growing recognition that the accuracy of energy models can be improved by using effective R-values, and steps are being taken to educate the industry on their use and importance. BC Hydro, in collaboration with several partners, has developed guidelines on how to account for thermal bridging in energy models.
Airtightness
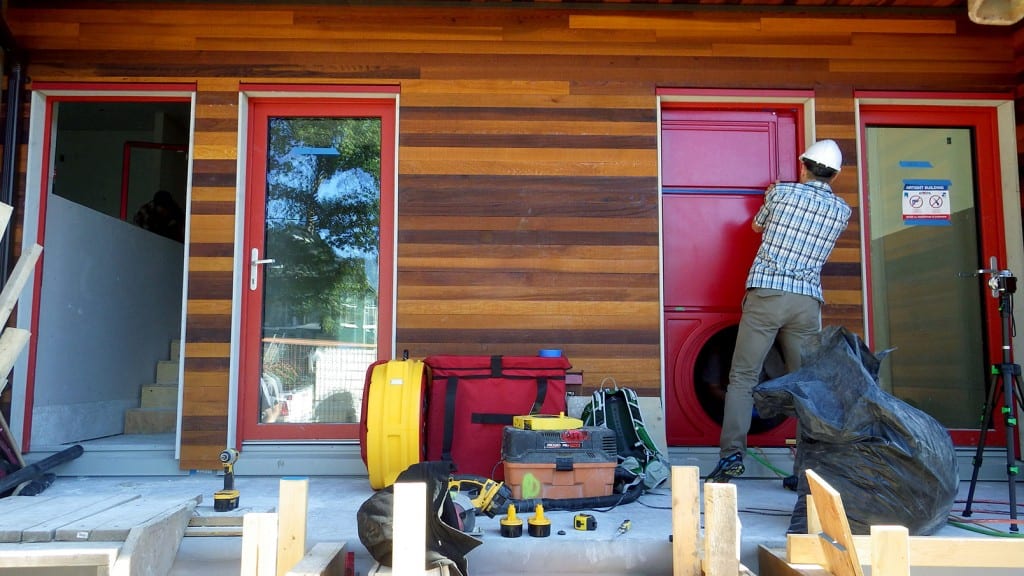
Another element of the building enclosure that can lead to differences in energy savings is airtightness. Currently, airtightness is still a large unknown, making any values entered into a model rough estimates that may or may not be reflective of the building’s level of air leakage. To remedy this issue, more research is required so that realistic typical values for airtightness can be established and used in future energy modelling, and so that buildings that achieve high levels of airtightness can receive credit for this energy conservation measure.
Plug and process loads
Electrical loads generated from miscellaneous plug and process loads used in the building are another factor that can account for differences in predicted and verified energy savings. This can include things like computers, appliances, server rooms, and other specialized equipment. Miscellaneous consumption can be extremely difficult to predict given that it is connected to occupant’s use of the completed building. This is reflected in the fact that, within the RDH study, rarely did the energy models capture all consumption associated with the building. In some cases obvious loads that would be present in the building were excluded from modelling, while in others it simply wasn’t known during design how the building or parts of the building would be used.
This was the biggest reason for the difference in building EUIs and total consumption, discussed in Part 1 of this blog series, but beyond simply moving the baseline up, the change in loads can also affect heating and cooling energy in the space and the resulting energy savings associated with heating and cooling energy conservation measures.
Lighting
One area where savings were generally realized, and in fact, often exceeded those predicted, was in the building’s lighting. Many of the buildings had longer operating hours than initially modelled, which led to greater savings from high efficiency lighting.
As part of the study, RDH and BC Hydro monitored the impact of occupancy and daylight sensors by using sensors to track how often the lights were on and off. Of light fixtures with occupancy sensors that we monitored in residential buildings, hallway lights were off about half of the time, parkade lights were off about 25% of the time, and amenity room lights were off about 90% of the time. In an office building that we monitored, lights with occupancy and daylight sensors were found to be off between 50% and 75% of the time.
Efficient lighting and controls with occupancy and daylight sensors are clearly an effective way to conserve energy!
Mechanical Systems
The last point that we’ll highlight as a key factor in the difference between predicted and verified energy savings is the building’s mechanicals. Several of the buildings in the RDH study showed reduced savings due to operational issues. For example, a couple of the buildings had heat pumps where the backup system operated more than planned. While these issues cannot be foreseen, it is important to recognize that when systems do not function as they should, there can be a significant impact on the building’s energy performance—enough to serve as a strong reminder of the importance of commissioning.
Summary
As you can see, there are a variety of factors that contribute to differences between a building’s predicted energy savings and its verified energy savings. Some of these can be mitigated through careful planning and the use of detailed and accurate values when creating energy models, while others require more research, and still others are unpredictable or accidental. All of this points to our next and final installment in this blog series, when we will discuss how you can assess your building’s performance and ensure it is performing at its best.


